Activation and Inhibition of Cell Signaling Pathways
Table of Contents
Introduction
Cell signaling is the physiological process by which cells detect and respond to extracellular and intracellular cues via a sequence of biochemical events encompassing ligand‑receptor binding, signal transduction through second messengers and protein networks, amplification, integration, and termination to produce specific cellular responses such as changes in gene expression, metabolism, or motility.
Principle
Cell signaling pathways can be modulated using diverse chemical, genetic, and biophysical approaches. Small-molecule modulators and kinase inhibitors selectively activate or inhibit targets such as receptors or kinases. Chemical genetic and dimerization methods enable rapid, reversible, and inducible control of signaling complexes. Genetic overexpression or knockdown adjusts protein abundance to enhance or suppress pathway activity. Optogenetics uses light-sensitive domains to control protein function with high spatiotemporal precision, while photoactivation and photocaging release active molecules on demand, allowing tightly controlled temporal regulation of signaling.
Equipment, Reagents & Consumables
|
EQUIPMENT |
CONSUMABLES |
|
|
|
|
|
REAGENTS Cells and Culture
Chemical Compounds and Modulators
Fluorescent Dyes and Assay Reagents
Genetic and Transfection Reagents
|
Stimulation Factors
Protein Analysis Reagents Antibodies
|
Protocol
1. selective small‑molecule modulators
Mechanism
Selective small-molecule modulators exert their effects on signaling pathways by binding directly to a defined target (e.g., a receptor, kinase, or other signaling protein) and altering its activity in a controlled way. In the case of G-protein-coupled receptors (GPCRs), agonists bind to the orthosteric site and stabilize an active receptor conformation that promotes G-protein coupling and downstream second-messenger generation, whereas antagonists block this activation and inverse agonists suppress basal activity. Allosteric modulators bind at distinct sites to enhance (positive allosteric modulator) or diminish (negative allosteric modulator) the receptor’s response to its endogenous ligand. This selectivity arises from structural complementarity with the binding pocket and often results in dose-dependent modulation of second messengers (e.g., Ca²⁺, IP₁, cAMP) without broad off-target effects when well characterized. Functional selectivity (“biased signaling”) can further direct a receptor toward specific downstream pathways (e.g., G-protein vs. β-arrestin), enabling therapeutic fine-tuning of cellular outcomes.
The molecular principles underlying GPCR activation, antagonism, and allosteric modulation, and their consequences for downstream Ca²⁺ signaling, are schematically illustrated in representative models of functional selectivity and biased signaling (Kenakin, Functional selectivity and biased receptor signaling, Nature Reviews Drug Discovery, 2011).
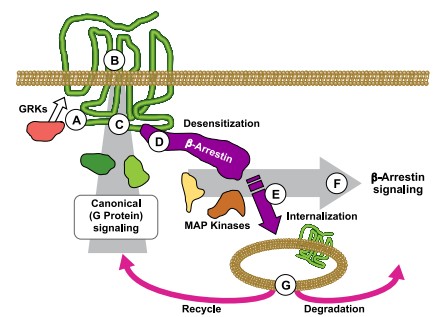
Fig1: Agonist binding activates G proteins and induces receptor phosphorylation by GRKs. The receptor acts as an allosteric scaffold that binds intracellular signaling proteins and extracellular allosteric modulators, thereby shaping downstream signaling. β-arrestin recruitment promotes receptor internalization and supports formation of MAP kinase signaling complexes in endosomes, generating sustained cytosolic signaling. Internalized receptors are either recycled to the plasma membrane or degraded, regulating signal duration.
Experimental Protocol: Ca²⁺ Mobilization Assay for G-protein-coupled receptors (GPCR) Modulators
This protocol follows a standardized fluorescence-based Ca²⁺ mobilization assay used to identify agonists, antagonists, and allosteric modulators of GPCRs that signal via intracellular Ca²⁺ release.
Experimental Overview
Measure intracellular Ca²⁺ changes in cultured cells expressing a GPCR of interest in response to test compounds. Agonists cause an increase in cytosolic Ca²⁺, antagonists block ligand-induced Ca²⁺ rises, and allosteric modulators shift the magnitude or kinetics.
Step 1: Cell Seeding and Preparation
Cells expressing the GPCR of interest (e.g., HEK293 stably expressing CXCR4 or another Gq-coupled receptor) are seeded into black, clear-bottom 96- or 384-well plates at a density optimized to achieve 70–90% confluence at the time of assay (typically 20,000–40,000 cells/well for 96-well format). Cells are incubated overnight (16–24 h) at 37 °C in 5% CO₂ to allow receptor expression and recovery from plating stress. Proper confluence ensures consistent receptor density and signal amplitude across wells.
Step 2: Dye Loading (Ca²⁺ Indicator Incorporation)
The culture medium is removed and replaced with assay buffer (e.g., HBSS supplemented with 20 mM HEPES, pH 7.4, and 2.5 mM probenecid to prevent dye extrusion). Cells are incubated with a membrane-permeable Ca²⁺-sensitive fluorescent dye such as Fluo-4 AM (final concentration typically 2–5 µM) for 30–60 minutes at 37 °C. During this time, the dye diffuses into cells and is cleaved by intracellular esterases into its active, Ca²⁺-sensitive form.
Step 3: De-esterification and Equilibration
After dye loading, cells are washed once or twice with fresh assay buffer and incubated for an additional 15–30 minutes at room temperature or 37 °C to allow complete de-esterification of the dye and stabilization of baseline fluorescence. This step minimizes background fluorescence and improves signal-to-noise ratios.
Step 4: Baseline Fluorescence Acquisition
Plates are placed in a fluorescence plate reader capable of kinetic measurements. Baseline fluorescence is recorded for 30–120 seconds to establish a stable pre-stimulation signal (F₀). This baseline is critical for normalization and accurate quantification of Ca²⁺ responses.
Step 5: Compound Addition and Kinetic Recording
Test compounds (selective small-molecule agonists, antagonists, or allosteric modulators) are added rapidly using an automated injector while fluorescence acquisition continues.
Agonists are added alone to assess direct pathway activation.
Antagonists are pre-incubated (5–30 min) before addition of a known agonist.
Allosteric modulators are co-applied or pre-incubated depending on their mechanism.
Fluorescence is recorded continuously for 2–5 minutes to capture peak Ca²⁺ release and decay kinetics.
Quality Control Measures
Assay Performance Controls
- Positive control agonist: A known ligand for the receptor confirms functional coupling of receptor to Ca²⁺ signaling. Absence of response indicates receptor misexpression or assay failure.
- Negative (vehicle) control: Defines baseline fluorescence variability and excludes solvent effects (e.g., DMSO ≤0.1%).
Results Interpretation
Agonist-Induced Activation
A rapid, transient increase in fluorescence (ΔF/F₀) indicates Ca²⁺ release from intracellular stores following GPCR activation. Dose-response curves are fitted to derive EC₅₀ values, reflecting agonist potency, while maximal response (Emax) reflects efficacy.
Antagonist-Mediated Inhibition
Antagonists reduce or abolish the agonist-induced Ca²⁺ signal. Competitive antagonists cause a rightward shift in the agonist dose-response curve without reducing Emax, whereas non-competitive antagonists reduce Emax. IC₅₀ values quantify inhibitory strength.
Allosteric Modulation
Allosteric modulators alter agonist responses without directly activating the receptor. Positive allosteric modulators enhance signal amplitude or potency (leftward shift), while negative modulators attenuate responses. Changes in curve slope or maximal response are hallmarks of allosteric mechanisms.
2. Chemical probes and kinase inhibitors
Mechanism
Chemical probes are potent, selective small molecules designed to modulate the activity of a specific target within a biological system, such as a particular kinase, serving as tools for elucidating biological mechanisms. Kinase inhibitors represent a subclass of these probes that block kinase catalytic activity by binding to critical functional sites, like the ATP-binding pocket, to prevent phosphorylation; they encompass ATP-competitive inhibitors that occupy the ATP site, allosteric inhibitors targeting sites outside the active site, covalent inhibitors forming irreversible bonds with the kinase, and degraders inducing target protein degradation.
Experimental Protocol: MEK Inhibition with U0126 (a Kinase Inhibitor)
Experimental Overview
The MAPK/ERK pathway conveys mitogenic signals from the cell membrane to the nucleus via sequential phosphorylation steps. U0126 is a chemical inhibitor that selectively blocks MEK1/2 kinase activity, preventing ERK phosphorylation and downstream signaling effects.
The following is a detailed, step-by-step experimental protocol in cultured cells to measure inhibition of the MAPK/ERK pathway by the MEK inhibitor U0126 to assess how U0126 inhibits MEK1/2 activity and consequently reduces phosphorylation of ERK1/2 in cultured cells using Western blotting to quantify phospho-ERK (p-ERK) levels.
Step 1: Cell Preparation
Seed cells into 6-well plates at ~60–70% confluence and incubate overnight to adhere.
Step 2: Serum Starvation
Replace medium with serum-free medium for 12–16 h to reduce baseline signaling and synchronize cells.
(Optional: allows clearer detection of signal induction and inhibitor effects.)
Step 3: Inhibitor Treatment
- Prepare U0126 dilutions (e.g., 0.1, 1, 5, 10 µM) in culture medium.
- Add inhibitor to wells; include vehicle control (equivalent DMSO).
- Incubate cells with inhibitor for 15–30 min at 37 °C. This allows U0126 to bind MEK and inhibit its activity.
Step 4: Optional Stimulation
To activate signaling, optionally add a growth factor (e.g., EGF) for 5–15 min.
This increases pathway activation and gives a dynamic range to assess inhibition.
Step 5: Cell Lysis
- Wash cells with cold PBS.
- Lyse cells on ice with lysis buffer + inhibitors to preserve phosphorylation.
Step 6: Western Blot
- Measure protein concentration (e.g., BCA assay), load equal amounts (20–40 µg).
- Run SDS-PAGE and transfer to PVDF.
- Probe with anti-phospho-ERK1/2, then normalize with total ERK1/2 and loading control.
- Detect bands using chemiluminescence and image.
- The full step-by-step Western blot protocol is described in detail in this protocol.
Quantification:
Use densitometry to measure intensity of p-ERK bands normalized to total ERK.
Quantitative comparisons across inhibitor doses indicate inhibition efficacy.
Quality Control Measures
Rigorous QC is essential for interpreting kinase inhibition experiments.
-
Vehicle control (DMSO only): Determines baseline phosphorylation in the absence of inhibitor.
-
No stimulation control (if growth factor used): Establishes basal ERK activation.
-
Positive activation control: Cells treated with growth factor without inhibitor should show elevated p-ERK.
-
Multiple inhibitor concentrations: Confirms dose-response relationship.
Dose-dependent inhibition of intracellular ERK phosphorylation by U0126 in COS-7 cells was demonstrated in Identification of a novel inhibitor of mitogen-activated protein kinase kinase (Favata et al., Journal of Biological Chemistry, 1998)
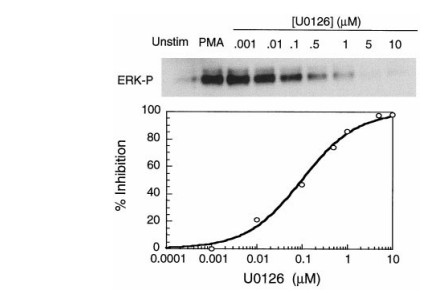
Fig2: In COS-7 cells stimulated with phorbol 12-myristate 13-acetate (PMA), ERK1/2 phosphorylation was robustly induced, whereas pretreatment with the MEK inhibitor U0126 resulted in a marked, dose-dependent suppression of phospho-ERK levels, consistent with selective inhibition of MEK activity.
Results Interpretation
Expected Results Pattern
- Vehicle + growth factor: High levels of p-ERK due to pathway activation.
- U0126 treatment: Dose-dependent decrease in p-ERK, with minimal effect on total ERK.
This indicates effective MEK inhibition preventing downstream signaling.
If p-ERK does not decrease, possible interpretations:
- Inhibitor concentration too low.
- Off-target effects dominating.
- Pathway activation independent of MEK.
3. Chemical Genetic & Dimerization Methods
Mechanism
Chemical genetic and induced dimerization methods are chemical biology approaches that enable acute, reversible, and spatially controlled activation or inhibition of cell signaling pathways through engineered protein–small molecule interactions rather than endogenous ligand binding or enzymatic inhibition.
Chemical genetics relies on modifying a signaling protein (typically a kinase or signaling effector) to render it uniquely sensitive to a synthetic small molecule that does not affect the wild-type proteome.
Chemical-induced dimerization (CID) uses bifunctional or monovalent small molecules (e.g., rapamycin) to induce proximity between engineered protein domains (e.g., FKBP and FRB). Forced dimerization can activate signaling by recruiting enzymes to substrates or membranes, or inhibit signaling by sequestration or mislocalization. CID allows temporal control on the scale of seconds to minutes and can be reversed by washout or competitive ligands.
Experimental Protocol: Chemical-Induced Dimerization Activation of the PI3K–Akt Pathway
The PI3K–Akt pathway is a central survival and growth signaling cascade activated at the plasma membrane. Akt activation requires recruitment of PI3K to the membrane, production of PIP3, and subsequent Akt phosphorylation.
In this protocol, rapamycin-induced heterodimerization is used to artificially activate PI3K signaling by recruiting the PI3K catalytic subunit (p110) to the plasma membrane via FKBP–FRB interaction, independent of receptor stimulation. Akt activation is assessed by measuring phosphorylated Akt (Ser473) using Western blotting.
This strategy was originally demonstrated to establish sufficiency of PI3K membrane localization for Akt activation.
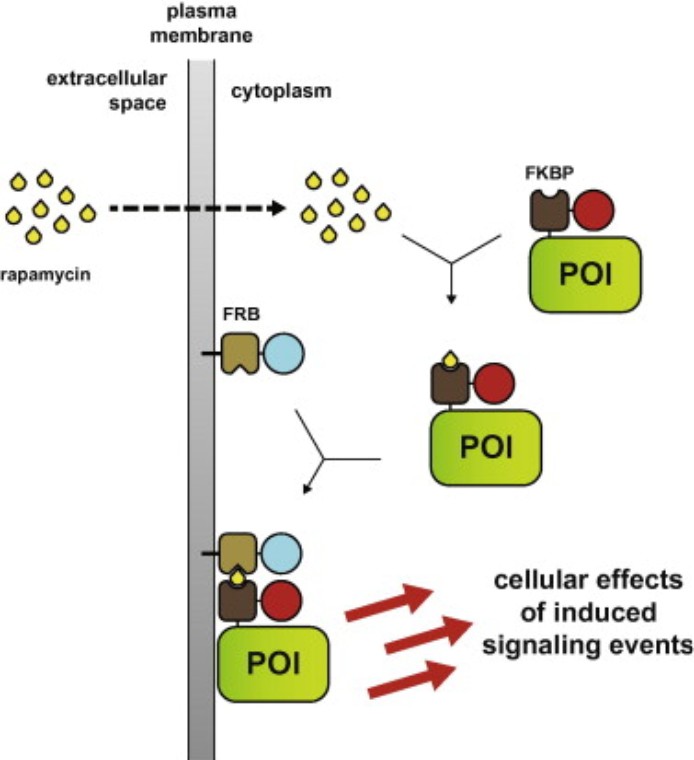
Fig3: Rapamycin induces FKBP–FRB heterodimerization, recruiting FKBP-tagged signaling proteins to FRB-anchored membranes, leading to rapid activation of downstream pathways such as Akt phosphorylation.(Putyrski, M., & Schultz, C. Protein translocation as a tool: The current rapamycin story. FEBS Letters, 2012).
Step 1: Cell Preparation and Expression of CID Components
-
Culture mammalian cells (e.g., HEK293 or NIH-3T3) under standard conditions (37 °C, 5% CO₂).
-
Transfect cells with the following constructs:
-
FRB-CAAX (FRB fused to a plasma membrane targeting motif)
-
FKBP-p110 (FKBP fused to PI3K catalytic subunit)
-
-
Incubate cells for 24–48 h to allow sufficient protein expression.
Step 2: Serum Starvation
-
Replace growth medium with serum-free medium.
-
Incubate for 12–16 h.
to reduce basal PI3K–Akt activity and improvesignal-to-noise for chemical activation.
Step 3: Chemical-Induced Dimerization
-
Prepare rapamycin working solution (final concentration: 10–100 nM).
-
Add rapamycin directly to culture medium.
-
Incubate for 5–30 min at 37 °C.
Rapamycin binds FKBP and FRB simultaneously, inducing heterodimerization and recruiting PI3K to the plasma membrane, initiating PIP3 production.
Step 4: Cell Lysis
-
Rapidly wash cells with ice-cold PBS.
-
Lyse cells on ice using RIPA or NP-40 lysis buffer supplemented with:
-
Protease inhibitors
-
Phosphatase inhibitors
-
-
Clarify lysates by centrifugation.
Step 5: Western Blot Analysis
-
Quantify protein concentration (e.g., BCA assay).
-
Load equal protein amounts (20–40 µg) per lane.
-
Perform SDS-PAGE and transfer to PVDF membrane.
-
Probe with:
-
Anti-phospho-Akt (Ser473)
-
Anti-total Akt
-
Loading control (β-actin or GAPDH)
-
-
Detect signals using chemiluminescence.
Step 6: Quantification
-
Perform densitometry analysis.
-
Normalize phospho-Akt to total Akt.
-
Compare rapamycin-treated vs untreated samples.
Quality Control Measures
Robust QC is essential for interpreting CID-based signaling experiments.
- No-rapamycin control:
Confirms that signaling activation is strictly chemically induced.
- Single-construct controls:
Cells expressing only FKBP-p110 or FRB-CAAX should not activate Akt.
- Rapamycin dose titration:
Ensures activation is concentration-dependent.
- Time-course analysis:
Demonstrates rapid kinetics consistent with direct pathway activation.
- Loading and expression controls:
Verify equal protein loading and comparable expression of CID components.
Results Interpretation
Expected Results Pattern
- Untreated cells:
Low basal Akt phosphorylation due to absence of PI3K membrane recruitment. - Rapamycin-treated cells:
Rapid and robust increase in Akt Ser473 phosphorylation without growth factor stimulation.
This demonstrates that forced PI3K localization is sufficient to activate the PI3K–Akt pathway, confirming causality between spatial organization and signal output.
4. Optogenetic and genetically encoded tools
Mechanism
In this study, an optogenetic system was engineered to control the Ras/Erk module by coupling light-induced heterodimerization modules to a Ras guanine nucleotide exchange factor (GEF) domain. The approach uses the Phytochrome B (PhyB) and PIF (phytochrome-interacting factor) light-inducible dimerization system: a membrane-localized PhyB fused to a CAAX motif and a cytosolic PIF fused to the catalytic domain of the Ras activator SOS (SOScat). Red light induces heterodimerization of PhyB and PIF, recruiting SOScat to the plasma membrane where it activates endogenous Ras, thereby initiating the RAF–MEK–ERK kinase cascade. When the activating light is turned off or cycled with inactivating conditions, the dimerization reverses, reversing Ras activation and allowing ERK phosphorylation to decay. This strategy isolates the Ras/Erk module from upstream receptors and natural ligands to interrogate its intrinsic transmission dynamics.
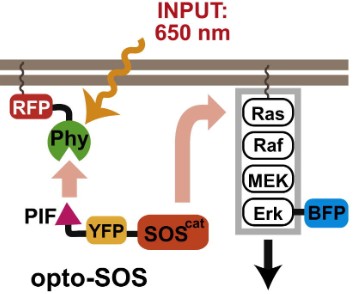
Fig4: Red light recruits PIF-SOScat to membrane-bound PhyB, activating Ras and driving nuclear translocation of BFP-Erk2. (Toettcher, J. E., et al. Using optogenetics to interrogate the dynamic control of signal transmission by the Ras/Erk module. Cell 155, 2013)
Experimental Protocol: Optogenetic Activation of Ras/Erk Module
Experimental Overview
The goal is to use red light to recruit opto-SOS (PIF-SOScat) to the plasma membrane via PhyB–CAAX, thereby activating Ras and following Erk phosphorylation dynamics in cultured cells. Endpoints include Western blot detection of phospho-Erk and live-cell imaging with an Erk activity reporter.
Step 1: Cell Preparation
Seed a mammalian cell line (e.g., NIH 3T3 or PC12 cells) in six-well plates or glass-bottom dishes at ~60–70 % confluence, and incubate overnight at 37 °C with 5 % CO₂. Optimal confluence ensures efficient transfection and even light exposure.
Step 2: Transfection of Optogenetic Constructs
Transfect cells with two constructs:
-
A plasma membrane–localized PhyB-mCherry-CAAX fusion, which anchors the red-light receptor to the membrane.
-
A PIF-SOScat-YFP fusion, wherein the PIF domain is fused to the catalytic domain of the Ras GEF SOS and tagged with YFP.
Use a lipid-based transfection reagent, and incubate cells for 24 to 48 hours to allow expression.
Rationale: The SOScat domain lacks intrinsic membrane targeting; its recruitment to the membrane by PhyB in response to red light enables specific activation of Ras independent of receptor stimulation.
Step 3: Baseline Measurement and Serum Starvation
Replace culture medium with serum-free medium for 12-16 hours prior to illumination to reduce baseline Ras/Erk activity, improving detection of optogenetically induced signaling changes.
Step 4: Optogenetic Light Stimulation
Place cells under a programmable LED illumination setup capable of delivering 650 nm red light pulses, which trigger PhyB–PIF heterodimerization. Illuminate with 1–2 minute pulses of red light (650 nm) followed by 750 nm far-red light to reverse binding if needed.
-
Red light (650 nm): recruits PIF-SOScat to Membrane → Ras activation.
-
Far-red light (750 nm): reverses PhyB–PIF association → SOScat returns to cytosol.
Illumination protocols can be varied in pulse duration and frequency to study dynamics. PhyB–PIF binding leads to recruitment of SOScat to the membrane, activating Ras and triggering downstream Erk phosphorylation.
Step 5: Time-Resolved Sampling
After defined illumination regimens, collect cells at multiple time points (e.g., 0 min, 2 min, 5 min, 15 min, 30 min) to capture signal transmission dynamics.
Step 6: Cell Lysis
Wash cells rapidly with cold PBS and lyse them on ice using lysis buffer containing protease and phosphatase inhibitors. Clarify lysates by centrifugation.
Step 7: Detection of Signaling Activation
Measure Erk activation via Western blot:
-
Quantify protein concentration by BCA or similar assay.
-
Load equal amounts (20–40 µg) on SDS-PAGE and transfer to PVDF membrane.
-
Probe with anti-phospho-Erk1/2 antibody and then anti-total Erk1/2 for normalization.
-
Detect using chemiluminescence.
Optionally, image live cells expressing a fluorescent Erk activity reporter to monitor localization dynamics.
Quality Control Measures
- Validate expression and localization of optogenetic constructs by fluorescence imaging: PhyB-mCherry-CAAX should localize at the plasma membrane and PIF-SOScat-YFP should show cytosolic distribution in the dark. Inadequate expression or mislocalization compromises light response.
- Include controls with no light stimulation to measure baseline Erk activity. Include cells transfected with one construct only to confirm that both PhyB and PIF components are required for light-dependent signaling.
- Ensure that total Erk levels remain constant across conditions to validate that changes in phospho-Erk are due to pathway activation, not altered protein abundance.
- Perform multiple biological replicates (≥3) to ensure reproducibility and assess variability in signaling responses.
Results Interpretation
Expected pattern: Upon red-light illumination, recruitment of PIF-SOScat to the membrane should activate Ras and lead to increased phosphorylation of Erk1/2 relative to dark-condition controls. Higher phospho-Erk levels correlate with duration and intensity of light input. Switching to far-red light should reverse PhyB–PIF association, leading to dissociation of SOScat from the membrane and a decrease in phospho-Erk levels over time.
If optogenetic stimulation fails to increase Erk phosphorylation, possible explanations include insufficient expression of constructs, inadequate light intensity, or incorrect timing. If phospho-Erk remains high after cessation of light, this may indicate slow dissociation kinetics or secondary signaling feedback.
5. Genetic overexpression/knockdown
Mechanism
Genetic overexpression and knockdown modulate the JAK/STAT pathway by altering the abundance of signaling proteins. Overexpression introduces exogenous DNA encoding key components, such as STAT3, JAK1, or constitutively active mutants, resulting in enhanced pathway activity. Knockdown uses siRNA or shRNA to reduce expression of these proteins, inhibiting signal transmission.
In the JAK/STAT pathway, cytokines such as IL-6 or IFN-γ bind to their receptors, activating receptor-associated JAK kinases. JAKs phosphorylate STAT transcription factors, which dimerize and translocate to the nucleus to regulate gene expression. Overexpression of STAT3 can lead to increased nuclear translocation and transcription even without ligand stimulation, whereas knockdown of STAT3 or JAK1 reduces cytokine-induced transcriptional responses. These approaches allow direct assessment of the function of individual pathway components.
Experimental Protocol: Genetic Knockdown of STAT3 to Inhibit JAK/STAT Signaling
Experimental Overview
The JAK/STAT pathway transduces cytokine signals to regulate immune responses, proliferation, and survival. In this protocol, siRNA-mediated knockdown of STAT3 is used to inhibit STAT3 phosphorylation and nuclear translocation. Pathway activity is measured using phospho-STAT3 (Tyr705) Western blot and optionally a STAT-responsive luciferase reporter assay.
Step 1: Preparation of Cells
Human cell lines such as HeLa, HepG2, or U266 are seeded into 6-well plates at a density of 50–60% confluence and incubated overnight at 37 °C in a 5% CO₂ atmosphere. Proper cell confluence ensures optimal transfection efficiency and healthy cell growth.
Step 2: Preparation of siRNA
Prepare siRNA molecules targeting STAT3 at a final concentration of 10–50 nM in serum-free medium. Include the following controls:
- A non-targeting scrambled siRNA to control for non-specific effects of transfection
- An optional positive control siRNA targeting JAK1 to verify pathway dependency
The siRNA will induce RISC-mediated degradation of STAT3 mRNA, leading to reduced protein expression.
Step 3: Transfection of siRNA
Combine the siRNA with a lipid-based transfection reagent and incubate briefly to allow formation of transfection complexes. Add these complexes dropwise to the cells and incubate for 48–72 hours to allow effective knockdown of STAT3 protein.
Step 4: Serum Starvation
Replace the culture medium with serum-free medium and incubate cells for 12–16 hours to suppress basal STAT3 phosphorylation. This synchronization step increases the dynamic range for detecting knockdown effects.
Step 5: Cytokine Stimulation
Stimulate cells with cytokines such as IL-6 at 10–20 ng/mL or IFN-γ for 15–30 minutes at 37 °C to activate STAT3 in control cells. This step allows for direct comparison between knockdown and control conditions.
Step 6: Cell Lysis
Wash cells gently with ice-cold PBS to remove medium. Lyse cells on ice using a lysis buffer supplemented with protease and phosphatase inhibitors to preserve protein integrity and phosphorylation states. Clarify the lysates by centrifugation and collect supernatants for analysis.
Step 7: Western Blot Analysis
Determine protein concentration and load 20–40 µg per lane for SDS-PAGE. Transfer separated proteins to a PVDF membrane and probe sequentially with the following antibodies:
- Anti-phospho-STAT3 (Tyr705) antibody to detect activated STAT3
- Anti-total STAT3 antibody for normalization
- Anti-β-actin or GAPDH as a loading control
Detect bands using chemiluminescence and record images.
Step 8: Quantification of Results
Perform densitometric analysis of phospho-STAT3 band intensity normalized to total STAT3. Compare knockdown conditions to scrambled siRNA controls across biological replicates to assess pathway inhibition.
Quality Control and Experimental Controls
- Validation of Knockdown: Confirm STAT3 protein reduction by Western blot or qRT-PCR. Incomplete knockdown can compromise interpretation.
- Negative Control: Scrambled siRNA establishes baseline pathway activity.
- Positive Activation Control: Cells treated with cytokine without knockdown should show robust phospho-STAT3 signal.
- Loading Control: Ensure total STAT3 or β-actin levels are unchanged to confirm equal loading.
- Replicates: Perform at least three independent biological replicates to ensure reproducibility.
Results Interpretation
Expected Pattern of Results
- Cells treated with scrambled siRNA and cytokine stimulation show strong phospho-STAT3 levels.
- Cells with STAT3 knockdown and cytokine stimulation show significantly reduced phospho-STAT3, while total STAT3 remains unchanged.
Interpretation: Effective knockdown demonstrates that STAT3 is essential for JAK/STAT signaling and cytokine-induced transcription.
Alternative Outcomes:
- No reduction in phospho-STAT3 may indicate incomplete knockdown or compensatory signaling by other STAT family members.
- Reduced total STAT3 indicates off-target effects or cell toxicity and invalidates conclusions.
6. Photoactivation
Mechanism
Photoactivation is a chemical–physical approach in which light is used to trigger a photochemical reaction that converts an inert molecule into an active signaling species. In cell signaling studies, this is most commonly achieved using caged compounds, which are bioactive molecules rendered inactive by a photolabile protecting group. Upon illumination with light of a specific wavelength, the protecting group is cleaved, releasing the active molecule with precise temporal and spatial control.
In contrast to optogenetics, photoactivation does not rely on genetically encoded light-sensitive proteins. Instead, it directly manipulates endogenous signaling pathways by releasing native second messengers, ligands, or inhibitors, such as calcium ions, cyclic nucleotides, ATP, or neurotransmitters.
In calcium signaling, caged Ca²⁺ chelators such as NP-EGTA or DM-nitrophen bind calcium tightly and prevent it from activating downstream effectors. UV or near-UV light cleaves the photolabile group, rapidly releasing free Ca²⁺. The sudden increase in intracellular calcium activates calcium-dependent signaling proteins such as calmodulin and CaMKII, leading to phosphorylation of downstream targets.
Because uncaging is typically irreversible, photoactivation provides a powerful method for initiating signaling with high temporal precision, but limited reversibility.
Experimental Protocol: Photoactivation of Ca²⁺/CaMKII Signaling Using Caged Calcium
Experimental Overview
The Ca²⁺/CaMKII signaling pathway regulates synaptic plasticity, muscle contraction, and transcriptional responses. Activation of CaMKII requires a rapid and localized increase in intracellular calcium.
In this protocol, cells are loaded with NP-EGTA-AM, a membrane-permeable caged calcium chelator. Upon UV illumination, Ca²⁺ is released intracellularly, activating CaMKII. Pathway activation is quantified by Western blot detection of phospho-CaMKII (Thr286).
Step 1: Cell Preparation
Seed cultured cells such as HEK293, neurons, or cardiomyocytes into 6-well plates or glass-bottom dishes at approximately 60–70% confluence. Incubate overnight at 37°C with 5% CO₂ to allow adhesion and recovery.
Step 2: Loading Cells with Caged Calcium
Prepare NP-EGTA-AM at a final concentration of 2–10 µM in serum-free medium containing Pluronic F-127 to enhance membrane permeability.
Incubate cells with the caged compound for 30–45 minutes at 37 °C. During this time, NP-EGTA-AM diffuses into cells and is cleaved by intracellular esterases, trapping the caged chelator intracellularly.
Step 3: Washout and Equilibration
Wash cells gently with buffered physiological saline to remove extracellular NP-EGTA-AM. Incubate cells for an additional 15–30 minutes to allow complete de-esterification and equilibration.
This step ensures that calcium release upon illumination originates from intracellular stores.
Step 4: Photoactivation by Light Exposure
Expose cells to UV light (typically 350–365 nm) using a microscope-mounted light source or UV LED for a defined duration, usually milliseconds to seconds depending on desired calcium amplitude.
Illumination cleaves the photolabile group of NP-EGTA, releasing free Ca²⁺ into the cytosol. The sudden calcium increase activates calmodulin, which in turn activates CaMKII via autophosphorylation at Thr286.
Step 5: Time-Resolved Sampling
After photoactivation, collect cells at defined time points, such as 0, 30 seconds, 2 minutes, 5 minutes, and 15 minutes, to capture signaling dynamics.
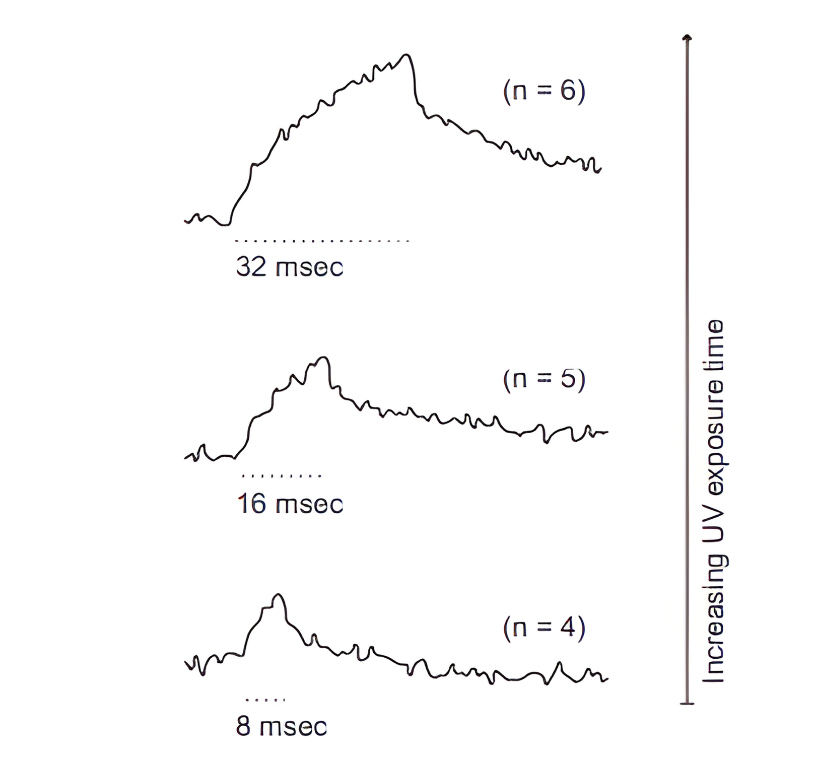
Fig6: The figure shows that UV uncaging of NP-EGTA induces intracellular Ca²⁺ transients in a time-dependent manner, with longer exposure durations producing progressively larger calcium increases, demonstrating quantitative control of Ca²⁺ release by uncaging time.(Eder, A., & Bading, H. Calcium signals can freely cross the nuclear envelope in hippocampal neurons: somatic calcium increases generate nuclear calcium transients. BMC Neuroscience, 2007).
Step 6: Cell Lysis
Rapidly wash cells with ice-cold PBS and lyse on ice using a detergent-based lysis buffer supplemented with protease and phosphatase inhibitors to preserve phosphorylation states.
Clarify lysates by centrifugation and collect supernatants for analysis.
Step 7: Western Blot Analysis
Measure protein concentration and load 20–40 µg per lane onto SDS-PAGE gels. Transfer proteins to PVDF membranes and probe with:
-
Anti-phospho-CaMKII (Thr286) antibody
-
Anti-total CaMKII antibody
-
Loading control such as β-actin
Detect signals by chemiluminescence and image.
Quantification
Perform densitometric analysis of phospho-CaMKII normalized to total CaMKII. Compare illuminated versus non-illuminated conditions to quantify photoactivation efficiency.
Quality Control Measures
Dark control: Cells loaded with NP-EGTA but not illuminated establish baseline CaMKII phosphorylation.
Light-only control: Cells exposed to UV light without NP-EGTA confirm that illumination alone does not activate CaMKII.
Calcium chelation control: Addition of fast calcium chelators such as BAPTA validates calcium dependence of signaling.
Loading control: Constant total CaMKII and housekeeping protein levels ensure equal protein loading.
Replicates: Perform at least three independent biological replicates.
Results Interpretation
Expected Results Pattern
-
NP-EGTA-loaded cells without illumination show low phospho-CaMKII levels.
-
UV-illuminated NP-EGTA-loaded cells show rapid and transient increase in phospho-CaMKII.
-
Total CaMKII remains unchanged across conditions.
This pattern indicates successful photoactivation of Ca²⁺-dependent CaMKII signaling.
Alternative Outcomes and Interpretation
-
No increase in phospho-CaMKII may indicate insufficient light exposure, incomplete loading of caged calcium, or strong buffering by endogenous chelators.
-
Sustained CaMKII activation may reflect excessive calcium release or impaired phosphatase activity.
Conclusion
The described approaches offer precise and complementary ways to modulate cell signaling. Each method provides unique control over pathway activity, from dose-dependent pharmacology to rapid, reversible, or light-inducible activation, allowing dissection of signaling dynamics and causality. Combined with rigorous controls and quantitative analysis, these tools enable mechanistic insights into cellular signal transduction and support the rational design of targeted interventions in both research and therapeutic contexts.